The world of business runs on numbers, always has and always will. Think of the pressures upon a business owner on a day-to-day basis. The company is always striving to improve sales numbers which will in turn improve revenue numbers which will in turn show a positive change in the balance sheet. You can run down this rabbit hole as long as you wish to see the sheer staggering amount of numbers that a business relies upon on a daily basis.
Some numbers are universal to business owners and are always looked upon when judging how well a business is doing. Revenue and accounts receivable are two such numbers that should always have some weight. Expenditures and taxes are two such numbers that should be as small as possible within the scope of business dealings. The simple math that always works is: Is the business taking in more money than its’ spending out? If it is, then the business is deemed a success. If it’s not, then the business is deemed as struggling or failing, depending on how bad the shortcoming is.
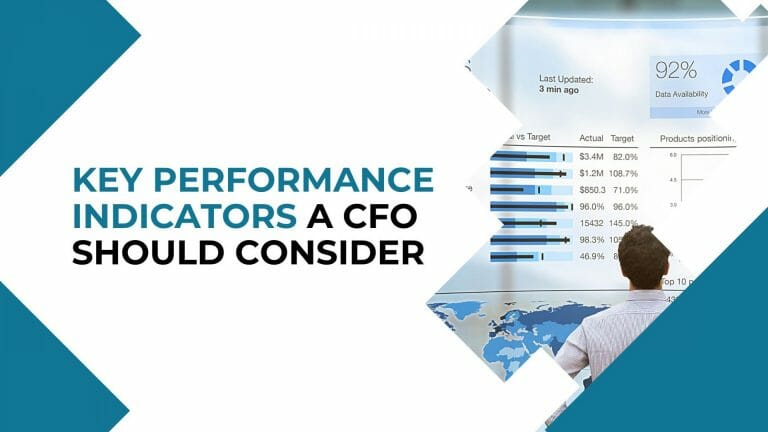
There are more detailed and simplified ways to judge the financial health of a business and these ways are known as KPI’s or Key Performance Indicators. We will look at the KPIs that an organization would use to keep tabs on the performance of the business.
Current Ratio
Current Ratio is the simplest KPI to use and monitor your business health. This indicator looks at the “basic” numbers to gauge how much a business owns versus how much a business owes. This ratio is based upon how much assets a business has versus how much in liabilities the company has. We will look at an example below:
Company “XYZ Holdings” has a business account balance of $25,000, raw materials of $25,000, and machinery / company cars worth $50,000. The company also has $50,000 in Accounts Receivable coming in within the next 30 days. Therefore, they have assets in total of $150,000. XYZ Holdings has Accounts Payable of $50,000, tax payments in total of $25,000, monthly payroll of $50,000, and monthly rental of the office building to the tune of $25,000. XYZ Holdings has liabilities in total of $150,000. In this situation, the ratio would be 1 as the total of assets and liabilities are the same. The business isn’t making money or losing money either, they are at break-even. Using this scenario, the business could cut expenditures and improve income to come out ahead in future months.
Working Capital
Working Capital is a KPI that expounds on what the business has available to them at the moment. The figure is reached by totalling up current liabilities and current assets and subtracting liabilities from assets. In this scenario, “current” means anything that is outstanding at the moment for liabilities (accounts payable, taxes, payroll, rent, expenditures, short-term loans, etc.) or can be converted into cash by the business within 12 months which includes stock options, short-term investments, prepaid expenses, and accounts receivable. Ideally, the business should have a positive number when subtracting liabilities from assets as this means that the business shows more assets than liabilities. Most advisors consider a ratio number between 1 and 2 to be a good place for a business to be at. If the ratio falls under 1, the business could possibly have liquidity problems in the future.
In the XYZ Holdings scenario in the previous paragraph, the company would have $0 for working capital and ostensibly, a working capital ratio of 1 which shows stagnancy and the possibility of future problems if the ratio doesn’t swing more towards a higher number in the following months.
Operating Cash Flow
Operating Cash Flow is a KPI that looks at the “real” profit that a business turns in during a month or quarter. The figure is compiled by taking the net income (revenue minus expenses) plus depreciation and subtracting this new figure by change in working capital. Everyone clued in with business knows that Gross Income only tells a part of the story. You peel back a layer of the financial onion to get the Net Income number and yet another layer comes off and this is where you get the OCF or Operating Cash Flow number.
We will take XYZ Holdings again as an example for this KPI. Instead of the business breaking even, we will have the company post a modest profit for the quarter. XYZ Holdings had $150,000 in revenue and $50,000 in expenditures for a net income of $100,000. XYZ Holdings has a small fleet of company cars that were purchased at inception. The fleet totals 15 cars and each car listed a depreciation value of $2,000 for a grand total of $30,000 in depreciation cost. The company also has a quarterly tax payment of $25,000 that is paid.
We will look at the numbers in sequence:
XYZ Holdings
Total Revenue – $150,000
Total Expenses – $50,000
Depreciation – $30,000
Taxes Paid – $25,000
OCF Formula
Net Income ($100,000) – Depreciation ($30,000) – Taxes ($25,000) = $45,000
($45,000) + Depreciation ($30,000) = OCF of $75,000
Accounts Payable Turnover
This KPI looks at the metric of how many times that you pay your vendors within the quarter and how much you’re paying out to them. This KPI is good for businesses to monitor how much outflow they have on the balance sheet and how they can possibly reign that number in a bit. The company can use this number to shop around with different vendors to get better prices on materials or to possibly lower rent payments with their landlord. This KPI is especially helpful to those businesses who are seemingly “bleeding” red with an overabundance of expenditures during a quarterly period.
Accounts Receivable Turnover
This KPI is the opposite of Accounts Payable Turnover, Accounts Receivable Turnover looks at the amount that the company charges its clients and how much your clients owe the company on a monthly basis. Businesses typically give customers 90 days to pay invoices with some businesses offering a small discount if the client pays within 30 days. This KPI will show whether a company has too much money “out” in the field being owed or if the company doesn’t have enough money “out” within the quarterly period. There is a danger of having too much money owed to the company as the company relies on these payments to have working capital for the day-to-day running of the business.
Conclusion
A business can get a good grasp upon how well they’re doing by going deeper than just “basic” numbers. Having KPI’s available to use and monitor can keep a company honest and have a watchful eye on the most-current numbers available. This advantage can help the company make informed decisions quickly to navigate the company on to calmer financial waters.


