As you will read below, the term “financial health” means different things to different people. In general terms, the management sees simple data and proclaims that the financial position of the company is really good.
While the ones with industry knowledge would look at certain key indicators and formulas to deduce if a company is doing well or not.
Let’s investigate the first topic which we’ve all been guilty of when you’re naive about what to look for in a company’s financial statements such as income statements, balance sheets, and cash flow statements.
Mistake investors make when they determine the financial health of a company
Information comes in a variety of mediums from the written word (Barron’s magazine, Finance section of your local newspaper, financial news website, etc.) to the spoken word (Financial News Network, Financial podcasts, Stock Market Gurus on news programs, etc.) and it’s ultimately up to you to discern the quality of the information when factoring in how well a company is doing.
You’ll invariably read or hear about a company doing X amount of dollars in sales or revenue for a financial quarter with comparisons to either the previous quarter or the previous year’s quarter to showcase how well or poorly a company is doing.
For example, you may read in big bold letters “BURGER KING DOES $3.3 BILLION IN Q3” and read that BK did only $2.8 Billion in revenue the previous quarter and $2.6 Billion in the previous year’s Q3. Your first thought would be that BK is on the upswing and is seemingly a company on the rise.
What the report won’t tell you is that BK expanded rapidly in Q2 with over 1,000 new locations around the globe. This expansion increased BK’s liabilities by a large margin which offset their asset acquisitions.
Perhaps more tellingly, even though overall revenues went up, the average revenue per store actually went down due to the increase in store locations. The big bold headline doesn’t seem so impressive once you take in all of the information, does it? Therefore it is important to determine the financial health of a company the right way.
The right way to determine the growth of a business is through the following factors.
Assess Financial Health with financial ratios
As previously stated, most people will simply look at a headline and see that a company did well in revenues and determine that the business is going well. This is simply not the case as there is much more data that needs to be analyzed before coming to that conclusion. Financial Health is the determination that is reached when a series of financial ratios are applied to financial data to reach this determination.
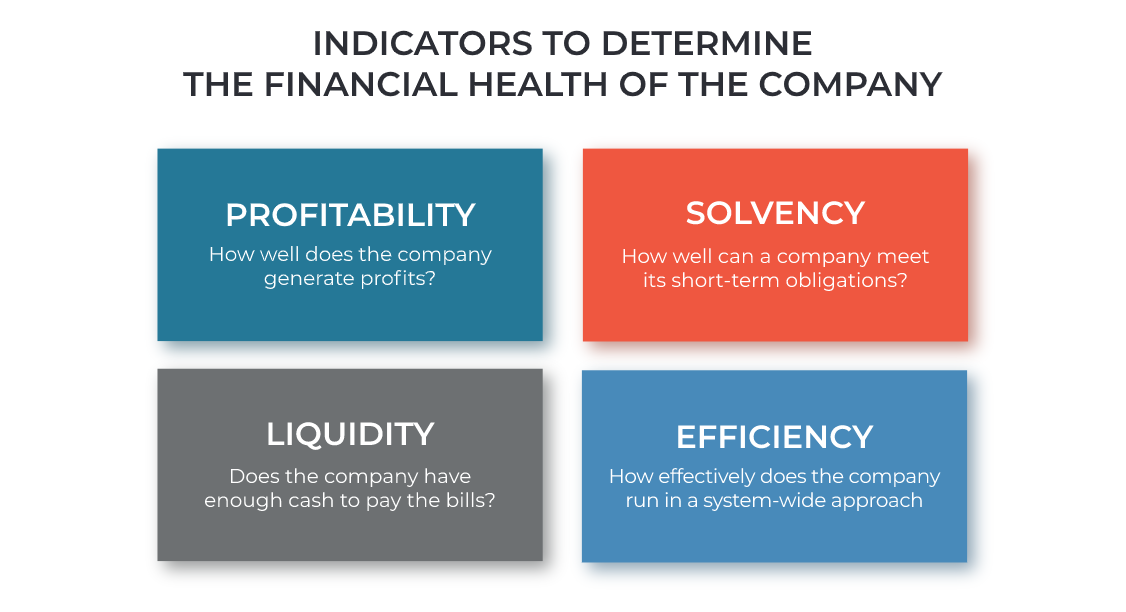
Going off of the “simple” data in the paragraph above, revenue is just one number in the financial combination to open the lock of financial health, so to speak. There are a few other numbers in the combination that you must figure out before being able to yank on the lock to open it. Revenue is the amount of money that a company takes in, what about the money the company pays out over the same time period? How much profit is the company taking in during this period? These are the different numbers in the combination that you need. The four big
indicators you need to determine the financial health of a company are liquidity, profitability, operating efficiency, and solvency. We will cover these four financial factors in detail below.
Liquidity
You’ve no doubt heard of this term before, how liquid is a company? How liquid is an investment? In the simplest terms, liquidity is how much amount of cash-on-hand that you have to spend. There’s a big difference between being cash healthy on paper versus being cash healthy on hand. If an emergency happens or a company needs to pay a vendor right away, they need to have the cash available or on hand to pay it.
To determine the liquidity of a company, there are two different ratios that you can look at to make that determination, Quick Ratio, and the Current Ratio.
Liquidity – Current Ratio
The current Ratio is determined by looking at the current assets (inventory, cash-on-hand, receivables, etc.) and comparing that number against the current liabilities (what a company owes such as accounts payable, long-term notes, etc.) and figuring out the ratio.
Liquidity – Quick Ratio
The quick Ratio is essentially the same as the Current Ratio but does not factor in inventory on-hand to get a faster determination of liquidity without delving deep into the numbers.
Liquidity – Determination
The basic number to look for is 1.0 in both methods of determination as that ratio will give a good glimpse into the short-term liquidity of the company. A ratio higher than 1.0 will showcase that the company has more current assets than it does current liabilities which means that the company is in good short-term health.
Calculate profitability score
Profitability is the “big picture” when determining the health of a company. What’s the end game goal for any company? To garner a profit either for the owners or the stockholders. This determination looks at three different margin data points to figure out the profitability of a company. These margins are GPM (Gross Profit Margin), NPM (Net Profit Margin), and EBITDA Margin. We will look at all three below in depth to see how these formulas all work together to showcase the profitability of a company.
Profitability – Gross Profit Margin
Gross Profit Margin is deduced from subtracting the Cost of Goods Sold from Revenue and then dividing that number by the Revenue and then multiplying this new number by 100 percent. In numerical terms, the formula looks like this:
GPM = [ (Revenue – Cost of Goods Sold) / Revenue ] x 100%
Profitability – Net Profit Margin
Net Profit Margin is deduced from dividing PAT (Profit After Tax) by Revenue and multiplying this new figure by 100%. In numerical terms, the formula looks like this:
NPM = (PAT / Revenue) x 100%
Profitability – EBITDA Margin
EBITDA stands for Earnings Before Interest, Taxes, Depreciation, and Amortization. EBITDA Margin is deduced by adding PAT, Interest, Taxes, Depreciation, and Amortization to get a total number from those data points. Then taking this number we can divide it by Revenue and then multiply this new number by 100%. In numerical terms, the formula looks like this:
EBITDA Margin = [ (PAT + Interest + Taxes + Depreciation + Amortization) / Revenue ] x 100%
Operating Efficiency
Operating Efficiency is the measure of how profitable a company runs in terms of a system-wide approach and not just by numbers alone. In better parlance, if a company has any bottlenecks in the business’s day-to-day operations (too much outflow in accounts payable, too little inventory, etc.) they will be reflected in the Operating Efficiency metric.
This metric is deduced by dividing operating expenses by net sales and then multiplying this new number by 100. In numerical terms, this formula would look like this:
OE = Operating Expenses / Net Sales x 100
Solvency
Up above, you learned that Liquidity measures how well a company can meet its short-term obligations. Solvency is the measure of how well a company can meet its long-term obligations. What are long-term obligations? Things such as machinery for a factory, notes on a company car, a mortgage on the building that the business resides in, basically any liability that has to be paid over a period longer than five years. The term “insolvent” also applies here which means that the company cannot meet its long-term obligations.
The factors that determine solvency are current assets and existing liabilities. Dividing these two numbers will produce a ratio that will determine how solvent a company is. If the ratio is above 1.0, the company’s current assets are greater than what it owes in liabilities and therefore has good solvency. If the number is below 1.0, then the company owes more than it has in assets and long-term solvency health is not good. In numerical terms, the formula looks like this:
Solvency = Current Assets / Existing Liabilities
Overall, Liquidity indicates a company’s ability to endure short-term disasters, whereas solvency indicates how easily it can cover long-term debt and commitments. Meanwhile, efficiency and profitability reveal something about the company’s ability to turn inputs into cash flows.
The Final Word
Data analysis and evaluation is one of the
best practices of financial performance management. When determining the financial health of a company, you must always look at the fine print. Look deeper into the numbers and data with the methods listed above and you will have a greater overall picture of how well a company is doing both short-term and long-term.